Texas Housing Insight

By James P. Gaines, Luis B. Torres, Wesley Miller, and Paige Woodson

June 2018 Summary

Texas housing sales fell 3.2 percent as activity slowed, especially in the $200,000-$300,000 price range. Housing demand, however, remained particularly strong amid the state’s continued economic expansion. Developers accelerated supply-side activity but struggled to match demand. The rate of single-family housing construction significantly lags pre-recessionary peak levels. Homebuilders continued to grapple with increased land, labor, and lumber costs, as well as increased regulations. A flood of new listings across the price spectrum (except for those below $200,000) provided marginal, yet necessary, relief to inventories after stalling last year. While the pause in sales activity moderated price pressures, housing affordability worsened across the state. Overall, the housing market fundamentals were unchanged in Texas, characterized by lagging supply and robust demand.

Supply*

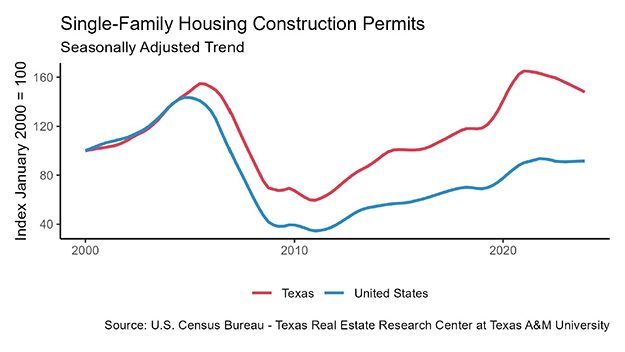
The Texas Residential Construction Cycle (Coincident) Index, which measures current construction activity, reached its highest level since 2008 as construction employment and wages elevated. This momentum should continue through the summer as the Texas Residential Construction Leading Index (RCLI) extended its upward climb amid gains in single-family housing starts and weighted building permits.

In response to housing shortages (primarily for homes priced under $300,000), Texas developers increased supply activity at the earliest stage of the construction cycle. The inventory of vacant developed lots (VDLs) rose 1 percent quarter over quarter (QOQ) in the Texas Urban Triangle, led mostly by 3.3 percent growth in Dallas-Fort Worth (DFW). The VDL inventory flattened in Houston and San Antonio and fell 10.9 percent year to date (YTD) in Austin.

Despite the overall uptick in lot development, single-family housing construction permits (unweighted) fell 1.8 percent in the second quarter, slowing YTD growth to 2.2 percent. Texas remained the national leader with 11,132 nonseasonally adjusted permits issued, accounting for 16 percent of the national total. Houston topped the metropolitan rankings, issuing 3,681 permits, followed by Dallas-Fort Worth at 3,295. Permit activity fell by more than 5 percent QOQ in both of the major metros. Austin held fifth place with 1,726 monthly permits after a 13.7 percent second-quarter increase. The San Antonio MSA, which has 358,000 more residents than Austin, issued just 759 permits.

Total Texas housing starts inched closer to pre-recessionary levels after stepping back in May. Single-family housing starts surged in the major metros, recording double-digit growth YTD across the board. In addition, multifamily investment continued to pour into the North Texas market.

Despite upward trending VDLs and housing starts, single-family private construction values fell 3.7 percent in the second quarter. Construction values dropped 6.9 and 5.4 percent QOQ in DFW and San Antonio, respectively, followed by Houston at 0.1 percent. On the other hand, Austin posted a 2.7 percent quarterly increase, pushing YTD growth above 4 percent.

The Texas months of inventory (MOI) remained constrained but posted its fourth consecutive uptick to 3.7 months. Around six months of inventory is considered a balanced housing market. The recent pause in sales activity and a flood of new MLS listings provided marginal relief to inventory constraints. Housing market imbalances, however, are far from over as demand outpaced the rate of single-family residential development. The recent inventory improvements occurred primarily for homes priced above $300,000 where supply is more stable. In the $200,000-$300,000 price range, the MOI held at 3.1 months, while the MOI for homes priced below $200,000 sank to an all-time low of 2.7 months.

The wave of new listings lifted the MOI across the major metros. Fort Worth maintained the lowest MOI at 2.4 months but reached its highest point in over two and a half years. Austin and Dallas hit YTD highs at 2.6 and 2.9 months, respectively, followed by San Antonio at 3.4 months. Houston was the exception, where steady sales volumes pressured the MOI down to 3.8 months after a three-month increase.

Demand

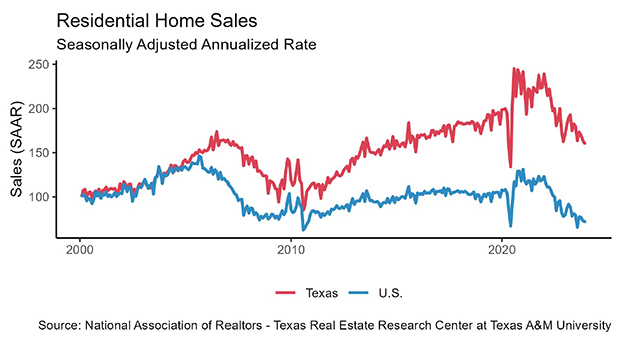
Housing sales fell 3.2 percent in June, pulling the YTD total down 1.9 percent. The softening occurred primarily for homes priced below $300,000, which accounted for two-thirds of sales through Multiple Listing Services (MLS). Sales on homes priced below $200,000 have slid since 2013, but the $200,000-$300,000 price range flourished until this year’s plateau.

This same price cohort hindered the markets in Austin, Dallas, and Fort Worth, where housing affordability declined substantially over the past year. Through the first six months of 2018, total housing sales dropped 9.2 percent in Austin, 5.7 percent in Dallas, and 4.1 percent in Fort Worth. Most of the North Texas decline, however, occurred in the resale market. New-home sales in the second quarter jumped 7.3 percent in DFW, approaching a decade-high. Austin’s new-home sales ticked down 1.2 percent QOQ but hovered closest to pre-recessionary levels. Total sales calmed in San Antonio after reaching record levels in May. In Houston, total sales increased 2.2 percent YTD amid a second-quarter boom in the new-home market.

Despite the pause in closed listings, Texas’ economic expansion bolstered housing demand. The average days on market(DOM) sank below 56 days for the first time since 2015. Austin, Houston, and San Antonio faced similar demand conditions with DOM at 53, 54, and 56 days, respectively. The Dallas DOM fell under 42 days after inching up over the past year, while Fort Worth homes flew off the market at an average of just 38 days.

Statewide, homes priced from $200,000 to $300,000 averaged 50 days on the market, corroborating that housing shortages, not demand, are hindering the market. Demand spilled into this price range as homebuyers struggled to find options priced below $200,000. The bottom price cohort (below $200,000) accounted for the largest proportion of sales through an MLS at 34 percent. In 2011, more than 72 percent of sales fell in this price range. Demand also heightened on the upper-end of the market (above $500,000) where the DOM reached a record low 78 days.

Concerns regarding international trade pulled investments into safe assets, offsetting robust economic data and weighing on interest rates after they reached multiyear highs in May. The ten-year U.S. Treasury bond yield ticked down 7 basis points to 2.91 percent, despite the Federal Reserve’s 25-basis-point increase in the federal funds rate. The Federal Home Loan Mortgage Corporation’s 30-year fixed-rate balanced below 4.6 percent after an eight-month climb. Despite the recent run, mortgage rates have held historically low since the Great Recession.

Prices

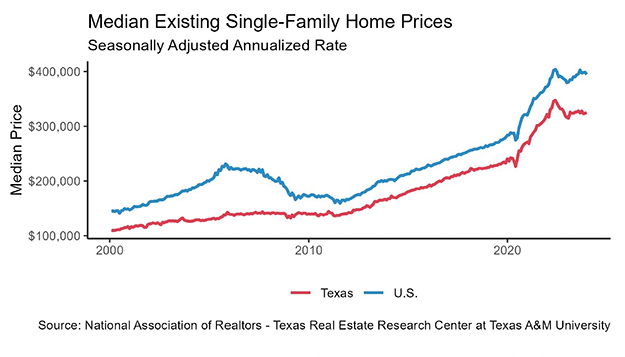
Texas builders reduced home sizes to combat rising land, labor, and lumber costs. The median square footage (sf) of new homes sold through an MLS fell to 2,283 sf, the smallest since 2011. Smaller homes for sale, combined with upticks in inventory, calmed home price appreciation. The Texas median home price fell to a six-month low below $229,000. The median price per square foot (ppsf), however, rose for the 13th consecutive month to a record high $115.53.

Austin led the state with a median price above $306,000, despite having a median square footage of just 2,187 sf for new homes—the lowest of any major Texas metro. As a result, the median ppsf increased $3.84 this year alone to $153.63. Dallas’ median price ($281,348) and ppsf ($131.45) flattened on the year as new-home square footage continued a yearlong slide. A similar phenomenon occurred in Houston, holding the median price and ppsf around $230,000 and $108.35, respectively. Fort Worth’s shift towards smaller homes was even more drastic, pushing the median ppsf above $119.25. Rampant demand and pronounced shortages, however, more than offset the adjustment as the median price increased 8 percent year over year to $233,475. San Antonio maintained the lowest median price of the major metros at $220,100, but its ppsf rose to $113.84.

Despite softening price pressures, the Texas Housing Affordability Index sank below 1.50 in the second quarter, the lowest level since the housing crisis. The index indicated that a Texas family earning the median income could no longer afford homes priced 50 percent above the median sale price. For much of the past decade, Texans enjoyed the capability of affording homes priced nearly twice that of the median. The Dallas index settled at 1.39, the lowest of the major metros, followed by Austin at 1.40. Fort Worth had the largest decline in affordability, matching Houston at 1.63. In San Antonio, the affordability index sank six points to 1.50 in the second quarter.

________________

*All monthly measurements are calculated using seasonally adjusted data, and percentage changes are calculated month over month, unless stated otherwise.


Original article: https://www.recenter.tamu.edu/articles/technical-report/Texas-Housing-Insight

The 5 Levels of Property Management Expertise

stages-property-management

By Drew Sygit

After several years of watching our competition, learning from them, and growing with them, we’ve come to the conclusion that there are definite stages that property managers evolve through as they perfect their skills. It’s not a terribly useful insight, unless you’re an investment property owner who is wondering if the property manager you’ve hired is as good as he claims to be. (Because frankly, we all claim to be great — the market pretty much demands it.)

So here’s what we’ve learned about the stages of property manager development.

Download Your FREE Rental Application Form!

It may seem like a small thing, but having a solid rental application is the first step in finding great tenants. Since BiggerPockets is all about helping you succeed in real estate investing, we’ve put together a complimentary Rental Application for you to use. Download it today and go find some great tenants!

Click Here For Your Free Rental Application

First Stage: Business-Focused

The brand new property manager is going to spend most of his time and energy thinking about and working on their property management business, simply because the business is the foundation of everything else that happens. At the beginning, none of us are familiar enough with the basic processes to be able to take shortcuts that more experienced PMs use automatically.

They’re still working out how to negotiate with contractors, figuring out which vendors to pursue relationships with, and working on the cost-benefit analysis of hiring advertisers, inspectors, real estate agents, and so on. Some PMs skip this step by working for other, more experienced PMs for a few years before they go off on their own.

project-management

Second Stage: Property-Focused

After they’ve got the basics of their business down, a property manager begins naturally to focus on the properties their clients are presenting them with. The questions change — for example, from “how do I get this building renovated?” to “how do I get this building renovated so that it will be attractive and last a long time?”

Related: Why I Fired Property Management — And Began to Manage My Own Investments

Property managers at this stage will learn what attributes of a building are deal-breakers (i.e. if the property is worth 30 percent more than any other building in the neighborhood, you’re never going to be able to fill the vacancy). This may lead to them also narrowing the type(s) of properties they’ll manage and getting rid of properties that don’t fit their focus. PMs at this stage do well as long as they don’t get a problem tenant, but if they do, things can fall apart fast.

Third Stage: Tenant-Focused

Once they’re confident in dealing with all of the aspects of the property itself, focusing on tenants is the natural next development simply because tenants are the source of 80 percent or more of the problems property managers face. A property manager at this stage is learning why it’s critically important to screen tenants with a special eye toward indications of future problems and why communicating with a tenant is vital not just to resolve problems, but to resolve potential eviction cases that make it to court as well.

A lot of times a PM at this stage will finally figure out they can’t hand-hold problem tenants and it’s better to just get rid of them. This is the first stage at which we would call a PM “ready” to be hired, but there’s still a long way for them to go.

property-management

Fourth Stage: Profit-Focused

Once the property manager is comfortable dealing with most of the situations that crop up with tenants and whatnot, they’ve gotten a grip on basically all of the major problems that PMs need to solve on a regular basis. This frees them up to concentrate not on problem-solving, but on profit margins. (Obviously, every PM has to pay attention to profit margins, but PMs before this stage can often feel like such things aren’t really in their control.)

The PM at this stage will be “purging” his business, seeking new vendors with better profits, outsourcing to advertisers with better rates of return, getting rid of problem owners and generally improving their ROI — but more importantly, they’ll also be improving your ROI at the same time.

Fifth Stage: Client-Focused

In the final stage of property manager development, the PM learns that not all clients are the same — some have goals other than “maximum ROI per month” — and learns how to adapt their systems to accommodate those other goals. If you’re a two-home family, for example, renting out your second home to save up for your child’s college education until you can pass the home along to said child, keeping the home in sterling condition is more important than maximizing your ROI.

Related: Property Manager Checklist: 7 Vital Tasks to Keep Tenants Happy & Paying

If you’re a local credit union with a foreclosure and you’re renting it until the market stabilizes and you can find a buyer who can pay a legitimate sum, your renovations will look different (and be more expensive) than those of a holding company who intends to rent the property for decades until the next real estate bubble swells. There are enough different clients in the world that this stage will take up the rest of the PM’s career — they will be adapting and evolving to their clients’ needs until they retire.

Unfortunately, there’s no real way to tell where a given PM is in their development without working with them for a few months and seeing what kinds of problems cause them to fluster and flail. All you can do is look at where those problems lie within the stages, and if your PM is stuck in the first 1-2 stages, either patiently wait for their learning curve development or start interviewing for a new property manager right away.

Investors: Have you noticed that the property management you’ve worked with is in one of these stages?


Original article: https://www.biggerpockets.com/renewsblog/2016/03/23/stages-property-manager-development/

Dallas Real Estate Market is Ideal For Investors According to the Home Buying Institute

(Photo: Daxis via Flickr)

By Joanna England

Three Texas MSAs are ripe for investors, according to a report from the Home Buying Institute. Markets in Austin, Dallas, and San Antonio are attracting investment at a breakneck pace, putting them in the top 10 best markets to invest in a home out of 100 MSAs. After an analysis by Forbes and Local Market Monitor, these three cities were named “Best Buy” housing markets. San Antonio beat the Dallas real estate market, with Austin following. the cities ranked third, sixth, and seventh, respectively.

Additionally, the Home Buying Institute named Dallas one of the hottest markets in 2016, and considering the pace at which sales are clipping along — especially cash sales from investors — we have to agree. The market is huge for builders and teardowns, which seem to happen every day in the Park Cities and East Dallas neighborhoods such as Lakewood and Forest Hills.

Jump to see what other cities landed on the Top 10 Best Buy Markets for Investors:


To find out which cities were poised to give investors a solid return, Local Market Monitor analyzed the 100 largest metropolitan statistical areas in the U.S. (all with populations of 600,000 or higher). They then identified housing markets with favorable conditions for investors and “regular” home buyers alike. These markets all have healthy job growth, population growth, and anticipated home price appreciation.

Top 10 “best buy” housing markets for investors, with average home price:

  1. Grand Rapids, MI – $154,348
  2. Orlando, FL – $202,809
  3. San Antonio, TX – $200,522
  4. Charlotte, NC – $220,758
  5. Salt Lake City, UT – $258,371
  6. Dallas, TX – $211,245
  7. Austin, TX – $281,355
  8. Fort Lauderdale, FL – $258,577
  9. Seattle, WA – $370,306
  10. Cape Coral, FL – $211,531


According to Zillow, home prices in Austin and Dallas rose by double digits last year. Additional, but more modest, gains are expected in 2016. This is partly due to the supply-and-demand imbalance mentioned earlier. In short, there aren’t enough homes for sale in these real estate markets to satisfy demand.

Local Market Monitor expects prices in these housing markets to continue climbing over the next few years. Their three-year home price growth projections for Austin, Dallas and San Antonio are all above 25%. The authors explained that “there continues to be a shortage of housing supply, meaning prices are likely to keep on rising.”


Original article: http://candysdirt.com/2016/02/19/dallas-real-estate-market-investors/


How Texas real estate broke records last year

Last year was huge for Texas real estate. In fact, statewide home sales and prices reached all-time highs in 2015, according to the latest Texas Quarterly Housing Report released today by the Texas Association of REALTORS®. More than 309,000 Texas homes were sold in 2015, which is the first time in history that annual home sales have exceeded 300,000. And the median annual price for Texas homes was the highest ever at $195,000. “Texas has enjoyed four straight years of booming real estate growth and record-high housing demand,” said Texas Association of REALTORS® Chairman Leslie Rouda Smith. Check out this infographic with statewide data, and download the full report to see data for 25 markets across Texas.

Original article: https://www.texasrealestate.com/advice-for-texas-realtors/article/how-texas-real-estate-broke-records-last-year

Filed Under: Blog, Featured

First-Time Home Buyers: The New Elite?

February 1, 2016 By

By Bob Sullivan

Is buying a first home becoming more a privilege than an American birthright? That’s the provocative question posed recently by Issi Romem, chief economist ofBuildZoom.com. And he answers it, cautiously, with data suggesting it’s true.

Romem’s most concerning assertion: Young buyers have nearly 10% higher incomes than they did less than a decade ago. The average household income for first-time buyers — as opposed to homebuyers who are trading up — is nearly $85,000, up from about $78,000 from 2004-2007. First-time homebuyers now come from higher up the income distribution than they used to, clocking in near the 60th percentile.

“The ability to transition into homeownership is gradually becoming the privilege of a narrower group of first-time buyers that is more financially select,” Romem says.

Fewer First-Time Buyers Stifles Economic Recovery

That leads to a second problem, one that impacts the entire economy: First-time homebuyers are conspicuously absent from home buying at the moment, which is stifling the economic recovery. In 2005, the U.S. hit an all-time high of 3.2 million first-time homebuyers, Romem says, but they buy fewer than 2 million homes annually today. That accounts for fewer than half of the nearly 4.65 million homes sold in the U.S. in 2015, according to figures from the National Association of Realtors.

First-time buyers are critical for the economy because their purchases set in motion sales for others who are trading up – usually, families looking to expand need to sell their “starter” homes first.

“A shortage of first-time buyers will cause the equivalent of famine in the housing market: a slowdown in home sales and presumably also in prices,” Romem wrote in a recent post titled “The Rising Income of First-Time Home Buyers.

Nationally, sales to first-time homebuyers are 16.5% below the historical norm, Romem says, but in some parts of the country, the dropoff is even more dramatic. In the West region, sales fall below the norm by 23.9%; in the South, by 22.6%. That compares with the Northeast, where sales to first-time buyers actually exceeded the historical norm by 3.6%.

There are two ways to look at the news. Tougher lending standards, such as larger down paymentrequirements, clearly have something to do with a dropoff in young buyers. That might help prevent a repeat of the housing bubble and collapse, said Logan Mohtashami, senior loan manager at AMC Lending Group.

The Upside: Today’s Homebuyers Are Qualified

“To be able to buy a home now more than ever…means you’re doing well in this economy. This cycle of homebuyers is the best I have ever seen in my 20 years,” Mohtashami said. Exotic interest-only or low-down-payment loans helped some buyers get into their first homes a decade ago, and that didn’t work out well for many of them. “I always wondered how much of the previous data was jaded because a lot of first-time homebuyers bought homes without the right income needed.”

On the other hand, the housing market is being buoyed by all-cash buyers – some investors, some foreign buyers – while young adults are renting in an expensive rental market or being forced to live with parents into their 30s. Ramem worries about the social issues that might create.

“The notion that homeownership is slipping out of reach for a growing share of the population is an uncomfortable one, especially if the trend continues,” he said. “Do we really want homeownership to become a privilege rather than a choice?”

Income is just one factor that affects your ability to qualify for a mortgage (and how much house you can afford). Your credit score is also a major factor. You can check your credit scores for free on Credit.com to see where you stand.


Original article: http://blog.credit.com/2016/01/first-time-homebuyers-the-new-elite-135552/

Filed Under: Blog, Featured

Important documents for your benefit!

January 29, 2016 By

First up here is the very beneficial Adjustment Guidelines for CMAs, as you saw in Cathy’s “No Or No Deal” presentation if you attended the Private Lending Network Event last night, which we’re providing in both PDF and Excel file formats:

Adjustment Guidelines for CMA (PDF)

Adjustment Guidelines for CMA (Excel)


And we’re also including a copy of a sample Insured Closing Protection Letter, also in PDF format:

Sample Insured Closing Protection Letter

(Note: This is just a sample of what an insured protection letter looks like, you need to request your own from the title company you’re using!)

Filed Under: Blog, Featured

NTTA board members question options for keeping up with Collin County’s growth

January 25, 2016 By

Rush hour traffic exiting at Tennyson Parkway in Plano, Texas, along the Dallas North Tollway on May 20, 2014. (Andy Jacobsohn/The Dallas Morning News)

By Brandon Formby

Rush hour traffic exiting at Tennyson Parkway in Plano, Texas, along the Dallas North Tollway on May 20, 2014. (Andy Jacobsohn/The Dallas Morning News)

An ongoing building boom along Dallas North Tollway in Collin County is prompting toll agency officials to question their preparedness for a crush of new residents and businesses.

At a North Texas Tollway Authority board meeting Wednesday, chair Kenneth Barr asked about the “long-term prognosis” of the northern stretch of the toll road that runs through Plano and Frisco. As the road has reached farther north in recent years, it has spurred billions of dollars worth of developments that are drawing major corporate relocations and high-profile mixed-use projects.

Which is going to mean more traffic.

“We have some obligation to look further into the future at what are our options are,” Barr said Wednesday.

The NTTA chair’s comments came ahead of a vote to add a fourth lane in each direction of the tollroad south of the President George Bush Turnpike. Construction is already underway to add new lanes to the road between the turnpike and the Sam Rayburn Tollway. But all that additional capacity falls south of where new developments are sprouting at break-neck speed.

“We do feel the growth in homes and businesses and working is staying to the north and not the south,” assistant executive director of infrastructure Elizabeth Mow told board members.

Sanjiv Yajnik, chair of the Collin County Business Alliance and a Capital One executive, said that growth is what keeps the local economy and quality of life “vibrant.”

“At the same time, it’s imperative that our road projects adequately meet the growth before it comes,” Yajnik said.

Plano and Collin County officials are currently developing ways to handle the expected traffic increases. The business alliance is also involved in those discussions.

Barr suggested that the toll agency board take a deeper look at the corridor’s rapid development at a future meeting. Unlike the state highway department’s North Texas districts, NTTA doesn’t have to wait for its share of statewide tax revenues to expand roadways. Instead, the toll agency uses a system finance model wherein toll revenues from several roads are pooled together and used to take on debt for new construction projects.

But widening the road may not prevent congestion in the corridor for several reasons. For one, the development is happening on the fringes of or completely outside transit agency boundaries. That means people will have virtually no other option but to drive to access the companies, businesses and homes in the area.

Additional highway capacity is also known to actually increase the number of drivers wanting to take a particular corridor, a phenomenon known as induced demand. NTTA officials touched on that topic Wednesday as they discussed DNT’s widening south of Plano and Frisco.

Board member William Elliott asked Mow how close current traffic levels are to reaching the capacity of DNT where new lanes are being added. Mow said she didn’t have exact figures but that it’s pretty much at capacity already.

“How much time are we buying with these improvements?” Elliott then asked.

Mow said “it’s impossible to tell” but estimated that after new lanes are added, traffic would reach the road’s capacity in five to 10 years.


Original article: http://transportationblog.dallasnews.com/2016/01/ntta-board-members-question-options-for-keeping-up-with-collin-countys-growth.html/

Filed Under: Blog, Featured

Is the Dallas-Fort Worth Housing Market Unstoppable?

January 20, 2016 By

Federal regulations, interest rate rise seem to have no impact

With no signs of slowing in sight, the North Texas housing market obliterated sales volume records in 2015. Even experts in the field are astounded by the rapid growth in the size of the market.

“We knew the market was very strong,” said Russell Berry, president of the MetroTex Association of Realtors. “We astounded to see sales volume at nearly $25 billion for the year. That’s an increase of $9 billion in one year. To give that some perspective, in 2011, our total sales volume was $9 billion.”

“We can see no discernable slowdown in sales despite a rise in interest rates,” continued Berry. “Rates are still low and buyers seem to have gotten the message that the small increase doesn’t have much impact on their monthly payments. We fully expect a robust market to continue for the foreseeable future.”

Highlights of the MetroTex market report include:

• Total sales volume for 2015 was $24,927,700,674, an increase of $9,051,887,636 over 2014. This is roughly equivalent to the total size of the market in 2011.

• 8,543 homes were sold in the DFW area in December, a 21% increase over last year.

• The average price per square foot is $114.

• The average sales price in Dallas/Ft Worth in December was $264,804, a 6% increase over last year.

• There are 6,179 homes under contract and waiting to close.

• Houses are selling in an average of 48 days.

• Condos are selling at an average of $155 per square foot in the area.

Inventory continues to remain low in the area. For homes listed for sale between $100,000 – $400,000, there is an average of 1.3 months of existing housing stock on the market. Less than 3 months inventory is considered to be a strong sellers’ market.

MetroTex represents more than 16,000 members involved in all aspects of the real estate industry. MetroTex is the largest REALTOR® member association in North Texas representing the entire region. Established in 1917, MetroTex is an advocate for the real estate industry and private property rights.


Original article: http://www.mymetrotex.com/news/dallas-fort-worth-housing-market-unstoppable

Filed Under: Blog, Featured

Is the Dallas-Fort Worth Housing Market Unstoppable?

January 14, 2016 By

Federal regulations, interest rate rise seem to have no impact

With no signs of slowing in sight, the North Texas housing market obliterated sales volume records in 2015. Even experts in the field are astounded by the rapid growth in the size of the market.

“We knew the market was very strong,” said Russell Berry, president of the MetroTex Association of Realtors. “We astounded to see sales volume at nearly $25 billion for the year. That’s an increase of $9 billion in one year. To give that some perspective, in 2011, our total sales volume was $9 billion.”

“We can see no discernable slowdown in sales despite a rise in interest rates,” continued Berry. “Rates are still low and buyers seem to have gotten the message that the small increase doesn’t have much impact on their monthly payments. We fully expect a robust market to continue for the foreseeable future.”

Highlights of the MetroTex market report include:

• Total sales volume for 2015 was $24,927,700,674, an increase of $9,051,887,636 over 2014. This is roughly equivalent to the total size of the market in 2011.

• 8,543 homes were sold in the DFW area in December, a 21% increase over last year.

• The average price per square foot is $114.

• The average sales price in Dallas/Ft Worth in December was $264,804, a 6% increase over last year.

• There are 6,179 homes under contract and waiting to close.

• Houses are selling in an average of 48 days.

• Condos are selling at an average of $155 per square foot in the area.

Inventory continues to remain low in the area. For homes listed for sale between $100,000 – $400,000, there is an average of 1.3 months of existing housing stock on the market. Less than 3 months inventory is considered to be a strong sellers’ market.

MetroTex represents more than 16,000 members involved in all aspects of the real estate industry. MetroTex is the largest REALTOR® member association in North Texas representing the entire region. Established in 1917, MetroTex is an advocate for the real estate industry and private property rights.


Original article: http://www.mymetrotex.com/news/dallas-fort-worth-housing-market-unstoppable

Filed Under: Blog, Featured

5 ways Texas real estate changed forever in 2015

January 8, 2016 By

This was a big year for Texas real estate. You and your clients will see 2015’s outcomes in many ways, including when you pay property taxes, use TREC or TAR forms, or close on a real estate transaction. Here are five of this year’s outcomes that are worth revisiting.

Success at the Capitol
The 84th Texas Legislature may have been the most successful legislative session in history for the Texas real estate industry, with changes affecting real estate brokers, HOAs, property managers, and others.

Closings have changed
New rules from the Consumer Financial Protection Bureau resulted in new forms and new procedures for closings.

A huge Election Day win
Statewide Proposition 1 on the November 3 ballot passed with 86% approval. The measure increased the homestead exemption for Texas property owners and permanently banned real estate transfer taxes in Texas.

Revised forms take effect New Year’s Day
The Texas Association of REALTORS® and the Texas Real Estate Commission revised several forms effective January 1, 2016.

Record-high housing activity
This may have been a record year for Texas real estate as all segments of the state’s housing market are showing strong gains


Original article: https://www.texasrealestate.com/advice-for-texas-realtors/article/5-ways-texas-real-estate-changed-forever-in-2015

Filed Under: Blog, Featured