Texas Housing Insight

Summary

The Texas economy continues to grow but at a more modest pace in the face of lower energy prices and a strong dollar. Total employment expanded but was weighed down by the manufacturing and oil and gas extraction sectors, especially in Houston. Housing demand remained strong throughout Texas while new construction was constrained by a shortage of skilled labor and limited developed lots.

Supply

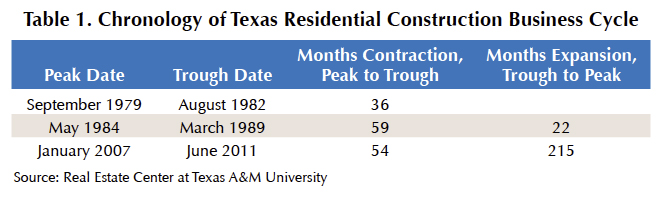
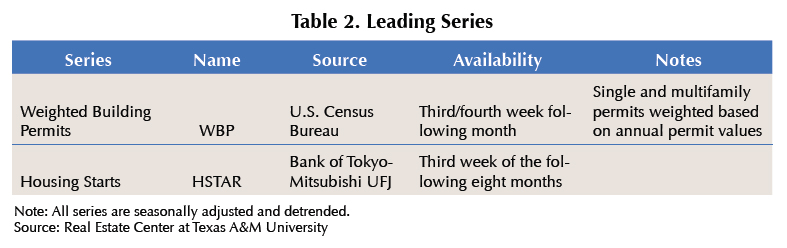
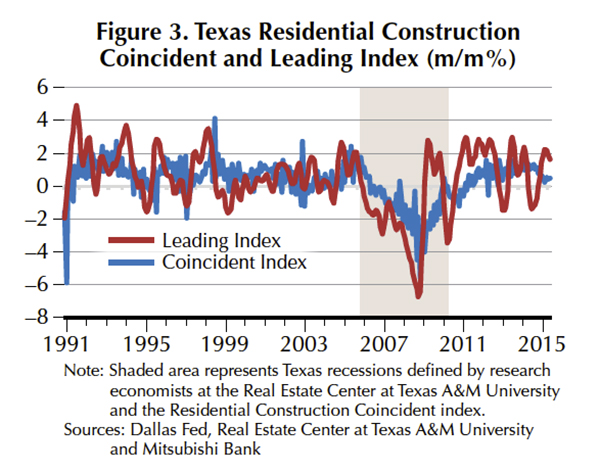
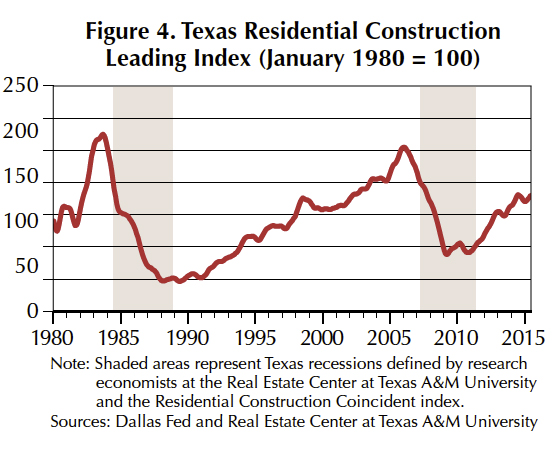
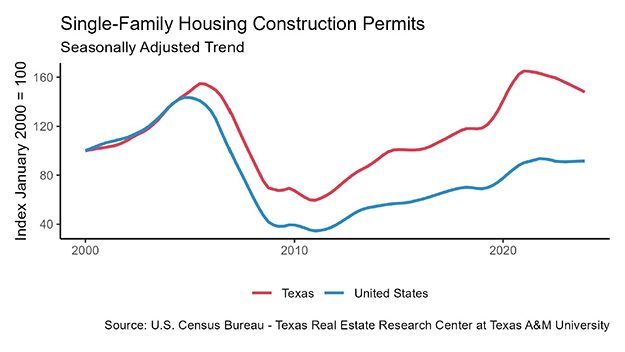
The Texas Residential Construction Leading Index (RCLI), which signals upcoming directional changes in the residential construction business cycle, registered a strong increase in October. The RCLI was positively affected by increases in weighted building permits and housing starts. The Texas Residential Business Cycle (Coincident) Index that measures current construction activity turned down in October after a slowdown in activity during prior months. Single-family housing construction permits statewide remained flat in October with declines in Austin and Houston and slowing in Dallas. No major MSA has reached its prior peaked permitting levels. Housing starts in Texas continued to climb in October 2015, helping to alleviate the restricted supply.

Months of inventory for existing homes across Texas remained low but registered modest upticks the past couple of months to 3.5 months of inventory in October (around 6.5 months of inventory is considered balanced).

Demand

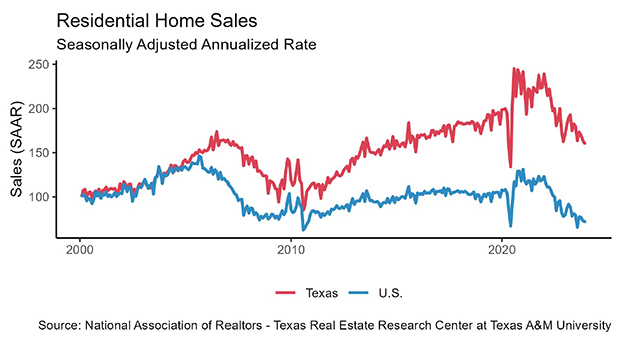
Texas housing sales passed January 2007 levels in August on a total seasonally adjusted monthly sales basis. In October, statewide housing sales increased 3.6 percent year-over-year seasonally adjusted although they decreased 2.1 percent on a not seasonally adjusted basis. Four of the five major Metros posted solid home sales increases. In October, Houston experienced a negative 2.9 percent year-over-year seasonally adjusted change (negative 11 percent not seasonally adjusted). Overall, 2015 Texas home sales remained positive, but the rate of growth has lagged behind the nation. Nationally, mortgage interest rates have remained slightly below 4 percent. In October, the Federal Home Loan Mortgage Corporation reported a 3.80 percent rate on a 30-year fixed-rate mortgage, while the 30-year U.S. Treasury bond yield equaled 2.89 percent. On December 16, the Federal Reserve raised the fed funds target rate and will make further adjustments depending on the performance of the national economy that could lead to somewhat higher mortgage rates in the future as monetary policy remains accommodative.

The number of days an existing home was on the market has remained low relative to prior periods reflecting the tight supply. New homes had somewhat longer sales periods in October in Austin and Houston compared to Dallas and San Antonio. The average statewide difference to sell a new home versus an existing home was 41 days in October, the largest difference since January 2011.

Prices

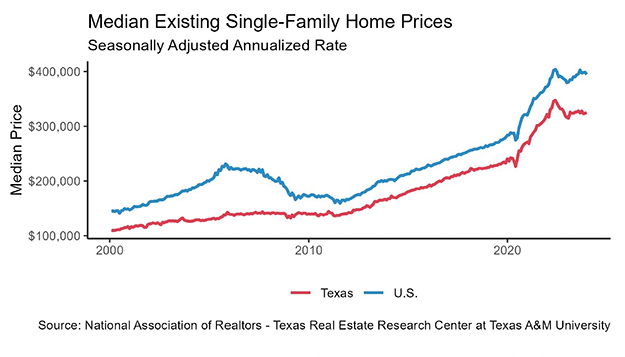
Average and median sales prices have risen dramatically in Texas since 2011 and continued to climb in October. The constrained supply in conjunction with strong demand accelerated price gains. Austin and Houston have been the house-price appreciation leaders in the first half of 2015 followed by Dallas and San Antonio. Due to recent declines in the energy sector and the resulting economic slowdown, Houston has begun to exhibit a softening in price growth. Non-energy employment growth and a strong services sector caused Dallas to register even stronger price appreciation.

Texas’ existing and new home sales prices have steadily climbed in the major Metros. Since 2011, on average, new home prices have been 48 percent more than existing home prices based on median sales prices and 37 percent more based on average sales prices. This is primarily because of increases in home size for newer homes and significant increases in construction and land costs. The price per square foot for a new home in Texas has been 20 percent more than for an existing home.

Even with rapid price appreciation, purchasing a home in Texas continued to be relatively affordable compared to the rest of the United States, but the gap appears to be closing.

Original article: https://www.recenter.tamu.edu/articles/technical-report/Texas%20housing%20economy%20leading%20index%20construction

New Texas Foreclosure Law Creates 15-Day Rescission Period

Effective September 1, 2015, a Trustee under a Deed of Trust which is secured by real property may, for a limited period of time, rescind a foreclosure sale of Texas residential property.  Relevant portions of the new statute, which was enacted as the result of Texas HB 2066, read as follows:

Not later than the 15th calendar day after the date of a foreclosure sale, a mortgagee, trustee, or substitute trustee may rescind the sale under this section if:

(1)  the statutory requirements for the sale were not satisfied;

(2)  the default leading to the sale was cured before the sale;

(3)  a receivership or dependent probate administration involving the property was pending at the time of sale;

(4)  a condition specified in the conditions of sale prescribed by the trustee or substitute trustee before the sale and made available in writing to prospective bidders at the sale was not met;

(5)  the mortgagee or mortgage servicer and the debtor agreed before the sale to cancel the sale based on an enforceable written agreement by the debtor to cure the default; or

(6)  at the time of the sale, a court-ordered or automatic stay of the sale imposed in a bankruptcy case filed by a person with an interest in the property was in effect.  Texas Property Code § 51.016(a).

For real estate investors who purchase Texas residential foreclosure properties, this law has the effect of delaying — and making uncertain — the finality of purchased foreclosure properties for the duration of the 15 day rescission period.

For lenders, this law has the effect of providing a “safe harbor” for the correction of mistakes; for borrowers, the law creates one last opportunity to retain ownership of the foreclosed property.


If you would like to see the entire bill analysis please visit the following link:

ftp://ftp.legis.state.tx.us/bills/84R/analysis/html/house_bills/HB02000_HB02099/HB02066E.HTM

Monthly Review of the Texas Economy

1862_hero

By Ali Anari

Texas’ economy is cooling. The state gained 204,800 nonagricultural jobs from October 2014 to October 2015, an annual growth rate of 1.7 percent, lower than the nation’s growth rate of 1.9 percent. The nongovernment sector added 181,900 jobs, an annual growth rate of 1.8 percent compared with 2.2 percent for the nation’s private sector.

The state’s seasonally adjusted unemployment rate fell to 4.4 percent in October 2015 from 4.7 percent in October 2014. The nation’s rate decreased from 5.7 to 5 percent.

All Texas industries except mining and logging and manufacturing had more jobs in October 2015 than in October 2014. The state’s leisure and hospitality industry ranked first in job creation followed by education and health services, professional and business services, information and trade.

All Texas metro areas except Wichita Falls and Texarkana had more jobs in October 2015 than in October 2014. San Antonio-New Braunfels ranked first in job creation, followed by Dallas-Plano-Irving, Austin-Round Rock, McAllen-Edinburg-Mission and Victoria.

The state’s actual unemployment rate in October 2015 was 4.5 percent. Amarillo had the lowest unemployment rate, followed by Austin-Round Rock, Lubbock, College Station-Bryan, Midland and San Antonio-New Braunfels.

Original article: https://www.recenter.tamu.edu/articles/technical-report/monthly-review-of-the-texas-economy

Texas housing is up across the board

1427910128_realEstate2

The year isn’t over, but signs say 2015 may be a record-setting year for Texas real estate.

The 2015 Texas Annual Housing Report, released today by the Texas Association of REALTORS®, shows increases in every segment of the Texas housing market, including sales of condos, land, and luxury homes, and sales to international and out-of-state homebuyers.

“The Texas real estate market has been firing on all cylinders in 2015. People are relocating to Texas from far and wide, homes in all price classes are in high demand, and the number of available properties is slowly rising,” said Scott Kesner, chairman of the Texas Association of REALTORS®.

Click here to see an infographic with these and other highlights:

  • More than 538,000 people moved to Texas from out-of-state.
  • International homebuyers accounted for more than $8.32 billion in Texas.
  • Small land sales increased 20.69% statewide.
  • Sales of million-dollar homes increased as high as 26% in major metros.

Want to learn more? Download the full report.


Original article: https://www.texasrealestate.com/advice-for-texas-realtors/article/texas-housing-is-up-across-the-board

2015 HOMEBUYER SURVEY CONTAINS VALUABLE INFORMATION FOR AGENTS AND HOME SELLERS

By Bob Hunt

One of the most useful research projects of the National Association of REALTORS® (NAR) is the annual survey of homebuyers and sellers. It is particularly useful because it shows sellers and their agents what works and what sources buyers use to find their new homes.

The most recent version (2015 Profile of Home Buyers and Sellers) became available in November of this year. The information is based on answers to a 128-question survey mailed to a random sample of 94,971 consumers who purchased a home between July 2014 and June 2015. (Names and addresses were provided by Experian, a company that maintains an extensive database of recent homebuyers that is derived from county records.) After accounting for undeliverable surveys, there was a 6.7 percent response rate.

In 2015, first-time homebuyers constituted just 32 percent of the market. This reflects a steady drop since 2010, and in fact is the lowest figure in more than a decade. Even with interest rates at record lows, the first-time buyer market is still quite weak. The tightening of lending standards is no doubt a major factor. Moreover, the widespread prevalence of student loan debt, combined with an economy that still remains uncertain for many in this cohort, has taken a toll.

The most useful information for sellers and their agents is to be found in the section on the home search process. While the survey results are not significantly different from those of recent years, the trends continue. For example, this year 77 percent of buyers said that they used the internet frequently during the search process. In 2003 that number was only 42%. This past year 41% of buyers said that they frequently used a mobile or tablet application. That is a newer and growing phenomenon. 68% of buyers said that they frequently relied on a real estate agent for information.

Forty-two percent of buyers went to the internet as the first step in the home search process. 14% contacted a real estate agent first, and 7% began by driving through neighborhoods looking for homes for sale. 13% first went online to find out about the process.

Buyers use multiple sources of information in the process of looking for a home. Far and away the most used sources are on-line websites (89%) and real estate agents (87%). Mobile or tablet applications (57%) have replaced yard signs as the third most used source of information. Still though, 51% of buyers indicate that yard signs are one of their sources of information. Only 20% of buyers indicate that they used newspaper ads as an information source. A mere 3% garnered information from television.

While there are a lot of intriguing data about the sources of information used by prospective homebuyers, certainly the most relevant has to do with where they actually found the home that they ultimately purchased. This year the information source that was highest in that category (44%) was the internet. Agents are second at 33%. Note that this is not to say that buyers bought their home through the internet. The typical scenario would be that a consumer sees the home on the internet, and then contacts his or her agent. 88% of those who used the internet to search purchased their home through an agent.

The differences in a little more than a decade are fascinating. In 2001, 48 percent of buyers learned about their home through a real estate agent, and only 8 percent found their home on the internet. The times they have changed.

Some things, though, remain persistently the same — or close to it. In 2001, a yard sign was the third most likely source of information leading to the home that was purchased (15%). And this year? It is still the third leading source at 9%, but this is now the third time in the survey history that it has been lower than double digits. Print media may not be dead, but it has shrunk to insignificance in this arena. In 2001, 7% of homebuyers found the home they ultimately purchased through a newspaper ad; in 2015, it was only 1%. Fewer than 1% found their home through a home book or magazine.

The 2015 Profile of Home Buyers and Sellers shows what works. It is a valuable resource.


Original article: http://nria.realtytimes.com/consumeradvice/sellersadvice1/item/40348-20151124-2015-homebuyer-survey-contains-valuable-information-for-agents-and-home-sellers

Happy Thanksgiving!

Wising everyone a very happy Thanksgiving holiday!
 
We’re thankful to everyone for the opportunity of working with you and making this year a great success!

Texas voters overwhelmingly support tax relief for homeowners

Thanks to strong support from the Texas Association of REALTORS®, statewide Proposition 1 passed with 86% of the vote. This resounding victory will save the state’s current and future homeowners money in two ways:

  • The homestead exemption will increase from $15,000 to $25,000, reducing homeowners’ property-tax burden.
  • Passage of this proposition also means real estate transfer taxes are constitutionally prohibited, which saves consumers money when they buy or sell property.

Thanks to all REALTORS® for spreading the word about the importance of this ballot item.

In addition, statewide Proposition 7, which the Texas Association of REALTORS® also supported, passed with 83% of the vote. Proposition 7 will help provide long-term transportation solutions by allocating a portion of sales and use tax revenue to the state highway fund through 2032.


Original article: https://www.texasrealestate.com/advice-for-texas-realtors/article/texas-voters-overwhelmingly-support-tax-relief-for-homeowners

A Leading Index for Texas Residential Construction

By Jesus Cañas, Keith R. Phillips and Luis B. Torres

The 2004–07 boom and bust in home prices and residential construction and its global financial crisis created a need for up-to-date economic indicators to help forecast changes in the residential construction sector. The Real Estate Center at Texas A&M University and the Federal Reserve Bank of Dallas collaborated to construct an economic index that estimates the timing and length of future upswings and downturns in Texas residential construction.

Leading Economic Indicators

Leading economic indicators frequently rely on future economic commitments, such as new orders for capital goods, or building permits. Some indicators, such as help wanted advertising, stock price indices and consumer confidence surveys, reveal expectations about future activity.

Leading indicators are analyzed to identify turning points in the business cycle. A good leading index will signal an impending upturn or downturn months before it actually happens. Leading indicators have the advantage of greater stability over time and across regions and sectors to predict changes.

Some weaknesses exist in the estimation of leading indices. The underlying indicators are subject to revision, and while errors often cancel out across indicators, one must still be aware of how revisions impact the index and thus the future monitoring of the business cycle. In addition, although leading indicators often indicate the direction of a business cycle, they do not measure the magnitude of the change. Even with these caveats, leading indicators have served a useful function in measuring business cycles.

Using the same methodology as the National Bureau of Economic Research (NBER), the Center identified previous business cycle turning points in Texas residential construction (Table 1). The Center’s designation of peaks and troughs in conjunction with the residential construction coincident index indicator will be used to measure the business cycle. This makes it possible to construct a series that predicts changes in housing construction. The differences in the business cycle between residential construction and the overall Texas economy were apparent during the Great Recession and the ensuing recovery. The Texas economy rebounded faster than the state’s housing market, likely a consequence of the boom in shale oil exploration.

To construct the leading indicators for Texas residential construction, economic data from 1990–2015 were evaluated with respect to the following:

  • economic significance,
  • statistical adequacy (in describing the economic process in question),
  • timing at expansion and recessions,
  • conformity to historical business cycles,
  • smoothness and
  • currency or timeliness (how promptly the statistics are available).

It is useful to examine variables specific to the dynamics of the residential housing market, such as changes in building permits and interest rates. These are important factors in determining the level of housing activity.

When creating a leading indicator, the measures of conformity and cyclical timing are given more weight. The Center used the same methodology as the Conference Board Leading Economic Index to measure conformity of a given series by studying the relationship between movements in the series and NBER peaks and troughs. The dates of the turning points are called reference dates, and the collection of reference dates is called the business cycle. This chronology identifies the peaks and troughs as expansions turn into recessions and vice versa.

The cyclical timing of potential leading indicators is judged by simply recording how many months prior to a peak (trough) the coincident index reaches a maximum (minimum). To do so, each series is plotted against the Texas residential construction coincident index to see if they match previous peaks and troughs in the Texas residential housing market business cycle. A good leading candidate series is expected to rise during expansions and fall throughout contractions. If the candidate series does not demonstrate a statistically significant relationship to the business cycle, that series is not useful.

Approximately 22 candidate variables were evaluated in the selection process. Eighteen are related to the Texas economy and four to the national economy. Four of the Texas variables — weighted building permits (weighted by average per unit housing values) for single and multifamily housing, housing starts, months of single-family inventory and median single-family household prices — are tied to the regional single and multifamily housing market. Four other Texas variables — nonfarm employment, construction employment, help wanted advertising for construction and maintenance positions and employment in architecture, engineering and related services — are tied to state and industry related employment.

Three of the Texas variables — loan performance, negative equity, loan to value — represent regional credit conditions, while the housing opportunity index is tied to housing affordability based on income and financial costs to purchase a house. Rents and apartment vacancy rates are related to multifamily housing, a substitute for single-family housing. Texas leading indicators measure the outlook for economic growth based on the Texas business cycle. Real oil prices, well permits and rig count represent the energy sector, a key component of the Texas economy.

Of the four national variables two — senior loan officer survey and lending conditions for acquisition, development and construction loans — represent credit market conditions. The housing market index, also available for the south region that includes Texas, is associated with builder confidence of those who build single-family houses. The last national series is the conventional confirming 30-year fixed mortgage rate, which represents the financing cost of purchasing a home.

Based on statistically reliable criteria, two variables were selected as Texas residential construction leading indicators: weighted building permits and housing starts (Table 2). These variables demonstrated a significant leading relationship with the residential construction market in Texas. All other variables were found not to be statistically valuable for the leading index.

Results and Evaluation

The Texas leading index for residential construction precedes the movements of the coincident index (Figure 1). The peak of the leading index for the housing bust led the September 2006 peak in the coincident index by eight months, achieving a maximum value in January 2006. A trough in the leading index led the April 2011 trough in the coincident index by 25 months, falling to its minimum value in March 2009 (Figure 2). Although the historical data includes a major downturn, it is fairly easy to note the occurrence of peaks and troughs in the leading index.

It may be difficult on a month-to-month basis to detect turning points as a result of the volatility in the leading index (Figure 3). A common rule used by the Conference Board with the leading index is that three months of consecutive declines signal an upcoming recession and three months of consecutive increases signal an upcoming recovery. Overall, the leading index is seen to be a good indicator to predict changes in the Texas residential construction business cycle as measured by the coincident index.

One major problem in evaluating the index in this study was the short duration of the period. To evaluate business cycle relationships, it is best to study the relationships over a long period and many business cycles. Because the coincident index starts in October of 1990, the period for this series to be evaluated was restricted (Figure 4). As each individual series was tested for its ability to lead the coincident index to the earliest possible date, no series could be tested prior to 1990. Because the predictive ability of the leading index was evaluated over a short time, the possibility always exists that the relationship might not hold in the future. Thus, the performance of the leading index for residential construction in Texas will be best evaluated based on its ability to lead the coincident index in the future.

Even though the coincident index for residential construction starts in October 1990, the research economists at the Center have identified the turning points of Texas residential business construction since 1980. These turning points serve as a benchmark to evaluate the performance of the leading index back to the 1980s (Figure 4). For the peak date (May 1984) identified for Texas residential construction, the leading index achieved its peak eight months earlier (September 1983). A trough in the leading index was registered in February 1988, 13 months before the identified trough in March 1989.  This demonstrates the usefulness of the leading index in predicting future movements in residential construction in Texas. Going forward, the Texas residential construction leading index should provide a reliable signal of weakness in residential construction, whether the growth declines or actually becomes negative.

The leading residential construction index was able to signal a directional change in 2006 that became the prolonged downturn that started in 2007. It also signaled a downturn in 1983 in advance of the strong recession that hit the Texas economy as a consequence of declining oil prices.  Even though the index has performed well, it is based on a relatively short period. The usefulness of this indicator will continue to be tested in the future to see if it signals directional changes in Texas residential construction. Currently, with data up to September 2015, the leading index is signaling a slowdown in residential construction activity caused by a deceleration in weighted building permits, contrasting with housing starts that register strong growth.


Original article: https://www.recenter.tamu.edu/articles/tierra-grande/leading-texas-residential-construction

3Q most profitable time to sell home in eight years

house2 for sale

By Brena Swanson

Homeowners who sold during the third quarter made more on average than any other quarter over the past eight years, according to a new Home Sales report fromRealtyTrac.

Homeowners realized an average price gain of $40,658 (17%) from the purchase price of their property, marking the highest average price gain for home sellers since the third quarter of 2007.

On average, home sellers in the third had owned their home for 6.72 years when they sold.

Click to enlarge

RealtyTrac

(Source: RealtyTrac)

“An increasing number of homeowners in 2015 have been cashing out the home equity they’ve gained during the housing recovery of the past three years,” said Daren Blomquist, vice president at RealtyTrac.

“That may be a good decision because the data points to a plateauing market going forward. Home price appreciation is slowing, a trend that will continue if interest rates rise in the coming months as expected. Meanwhile the threat of rising interest rates combined with lowered premiums for buyers using FHA loans is spurring more demand.”

Meanwhile, the report also said that buyers using Federal Housing Administration loans accounted for 23.4% of all single family home and condo sales with financing in the third quarter of 2015. This is up from 23.2% in the second quarter and up from 17.9% in the third quarter of 2014 to the highest share since the second quarter of 2012.

“Home sales in the third quarter saw an increase in first-time homebuyers in the area,” said Michael Mahon, president at HER Realtors, covering the Cincinnati, Dayton and Columbus markets in Ohio.

“With FHA loans accounting for nearly a third of the overall purchase transactions across the state, low interest rates, and the tax benefits of homeownership continue to be driving factors for home buyers to elect to purchase, versus renting,” he added.


Original article: http://www.housingwire.com/articles/35535-the-third-quarter-was-the-most-profitable-time-to-sell-in-eight-years

HOME BUYERS: SEVEN INSIGHTS INTO CONFIDENT DECISION MAKING

By PJ Wade

Home-buying is multi-tasking on steroids. Are you up for the challenge?

On the surface, buying a home seems simple: find your dream home and buy it.

In reality, this seemingly-simple task requires buyers to make a continuous stream of under-pressure decisions, often concerning issues and consequences they do not fully understand. Instead of one task, buyers are faced with hundreds of tasks many of which must be decided on simultaneously, on very short deadlines. This makes decision-making a challenge, but it’s the knowledge gaps and “I’ve never thought about this before” perspectives revealed in smart home buying that add the real pressure.

At its best, purchasing real estate is an exhilarating race through a labyrinth of snap decisions ending with the purchase of real estate. At its worst, home buying can become a multi-tasking nightmare culminating in the purchase of the wrong property, in spending too much, or in no purchase at all.

To swing the outcome in your favor, one key task is choosing the “best fit” real estate professional to guide you through the home-buying process. This real estate expert will keep you fully informed, so that even snap decisions are solid choices you will thrive on.

Face the complexity of successful home buying head on and it will not overwhelm you.

Purchasing real estate involves making a series of decisions which combine to address the essentials of successful real estate ownership. The “I’ve never thought about that before” perspectives that challenge decision making, especially for first-time buyers, can be categorized by the specialized knowledge required.

Here are Seven Insights into Successful Multi-Tasking:

#1. Investment: What is the value-appreciation potential of the property?

Does it seem strange to think about resale value when you haven’t even purchased yet? This perspective is important since it reveals current value deficits. In addition, after paying off the mortgage (and many thousands in interest), and maintaining and improving the property over the years ahead, you’ll want to recover these costs and make a profit to finance the next phase of your life. Even a “forever home” should be purchased with investment in mind since the future is full of surprises. Location is key to resale value. The best strategy is to buy the least property in the best neighborhood you can afford.

#2. Lifestyle: Which lifestyle values should the chosen property reinforce?

Are you determined to spend your time, money, and effort on accumulating “stuff” and teaching your children to do the same? If so, square-footage, lots of storage, and a bedroom each may be essential. If your values go beyond materialism, the size of the building may not be as important as highly-functional interior design, the surrounding community, and local amenities and green spaces. Shop neighborhood before you start looking at individual homes.

#3. Benefits: How do you expect ownership to benefit you and your family?

We addressed investment and its links to your financial future in #1. How else do you expect the home and neighborhood to benefit your family? For instance, locating near select schools has taken priority over locating adjacent to work for many buyers, but make sure the school in question is not so over-populated that its standards are slipping. Compare the cost of alternatives schools to the premium that real estate in “star school” neighborhoods demands. If a private school or home schooling is intended, “star” amenities may take priority over neighborhood schools.

#4. Time Management: How should your real estate support income earning?

Jobs tend to be more plentiful in urban areas. Real estate prices are usually lower and appreciation slower further away from urban centers. The expense of commuting to work goes up the further away you live. Do the math to determine what you’ll net in salary after deducting the cost of commuting. Add a calculation of how many extra hours the distance will take from your family, interests, health, and fun. Only you can determine what this time is worth when you evaluate the value of buying a larger home further from city center.

#5. Property Management: How much time and money will maintaining and regularly modernizing your property require?

Gardening can be a great joy, but mowing a large lawn can be a great responsibility—and an expense if you pay someone else to mow. The larger the house, the higher the taxes, the bigger the roof, the more plumbing and wiring involved, more windows to decorate, more furniture to buy, and more space to heat and cool…. The costs attached to maintenance are annual, increasing expenses and should be considered when setting the budget for a purchase.

#6. Borrowing: How much will the cost of borrowing add to the overall cost of home ownership?

Mortgage interest and related costs are not the cost of real estate since not everyone needs a mortgage. These expenses relate to borrowing, but they can be large enough to make you house rich and cash poor. Financially stretching for a dream home, may be your choice knowing your earning power is on the rise.

#7. Backup: How will I find reliable, accurate, unbiased answers to my questions during the buying process?

GoogleTM should not be your “go-to” resource during home buying because it holds no liability if you get the wrong information or if you don’t know what you don’t know and should know about a topic. Settle on a real

estate professional with the knowledge and experience relevant to the locations and type of real estate you are interested in. When you ask this local expert a question, they will know the complete answer or know how to get it. Real estate professionals understand that they carry fiduciary responsibilities to provide the right information at the right time, so their client (that’s you) can consistently make confident decisions to achieve their stated goals.

The more you understand the home-buying process before you start, the better prepared you’ll be for a multi-tasking decision-making marathon. The many small decisions about style of home, mortgage term, closing date, garbage and mail services, side of the street, distance to medical services and the firehall etc… will be manageable. You’ll be ready to confidently make significant decisions about which property, how much to spend, and which responsibilities to commit to in the offer to purchase.


Original article: http://nria.realtytimes.com/consumeradvice/buyersadvice1/item/39541-20151027-home-buyers-seven-insights-into-confident-decision-making